The Designer is shipped with an Impact Analysis utility that offers the possibility to graphically visualize where a Metadata is used in the current Workspace, what are the sources loading it, and what are its targets.
This can help for instance to find which sources are loading a specific table, and what this table is loading next.
More generally, this allows to see where data comes from, and where it goes.
This article explains how to use the Impact Analysis utility to accomplish this.
Prerequisites:
- Stambia DI Designer S19.0.0 or higher
Impact Analysis
Overview
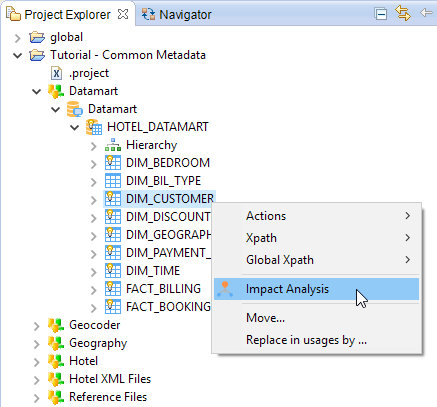
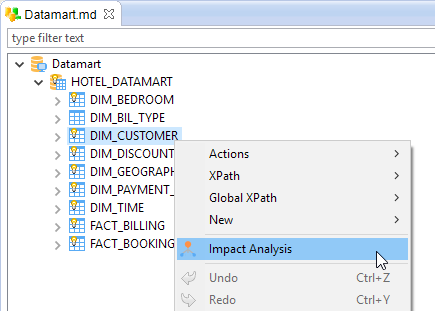
To perform an Impact Analysis, simply right click on the Metadata node in the Project Explorer or in the Metadata Editor, and select Impact Analysis.
In the Project Explorer:
Or in the Metadata Editor:
The Impact Analysis utility will then open, and here is an overview of its buttons and views:
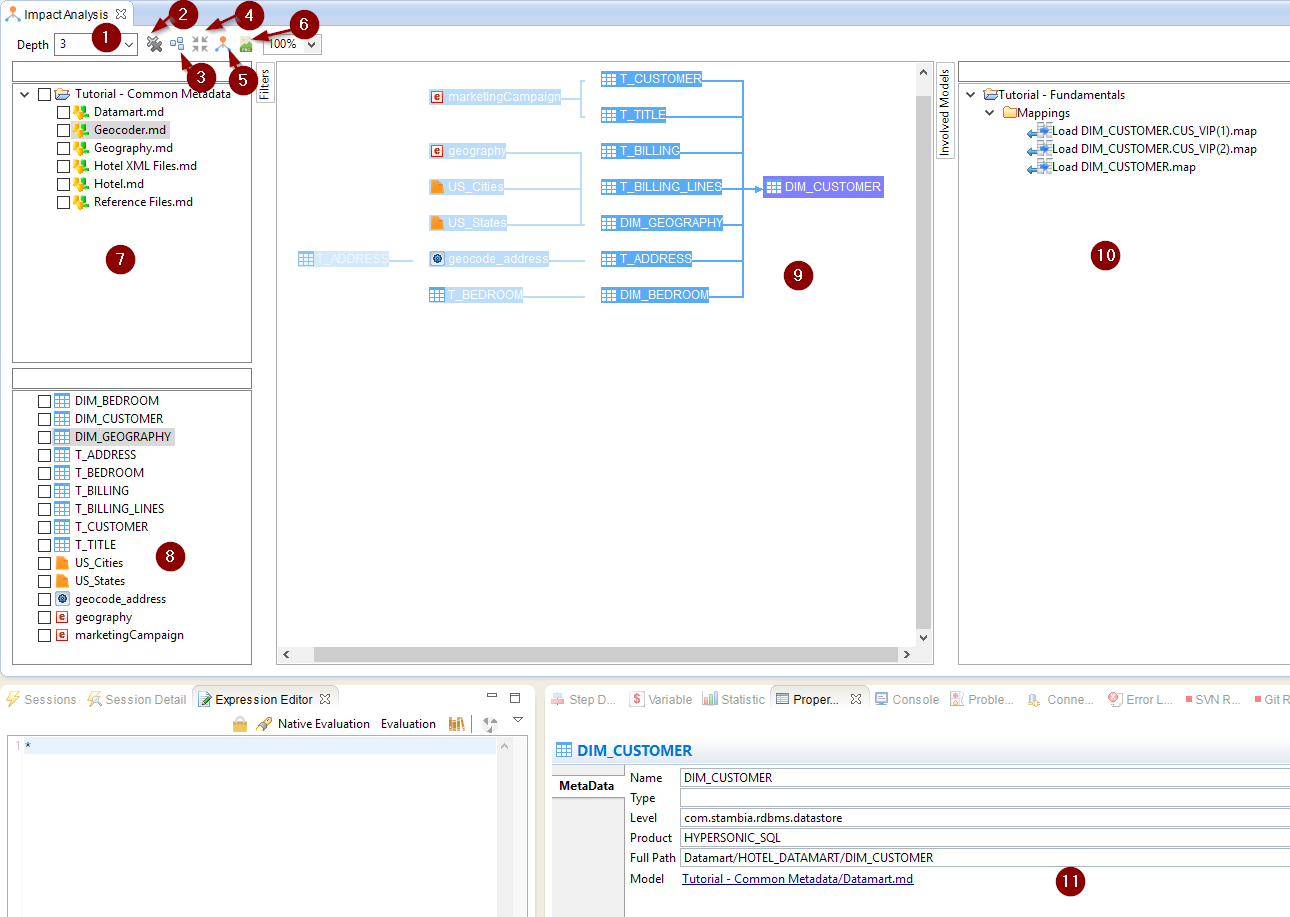
And below their description:
| Screenshot Number | Name | Description |
| 1 | Depth |
Number of ancestors and children levels to be shown. The default depth when performing an analysis is 1, so only showing the direct ancestors and children. The Reset Analysis button must be used to update the analysis when the value is changed. |
| 2 | Reset analysis | Resets the current analysis with the current settings. |
| 3 | Arrange all | Re-arrange automatically the analysis editor display |
| 4 | Reveal real node | When the same node appears multiple time in a analysis, clicking on this while one of these node is selected will automatically focus on the one that impacts the target of the analysis. |
| 5 | New analysis |
Performs a new analysis on the currently selected node. This opens a new Impact Analysis Editor. |
| 6 | Export as PNG | Export the current analysis as an image |
| 7 | Metadata file filter |
This part allows to filter from the analysis the nodes that are located in the checked Metadata files. When a Metadata is checked, all the nodes contained in will be hidden in the analysis. |
| 8 | Metadata node filter |
This part allows to filter from the analysis the nodes that are checked. When a node is checked, it will be hidden in the analysis. |
| 9 | Analysis editor |
Editor in which the analysis is displayed. Users can click on the nodes to visualize its impact and flow. When clicking on a node, the Properties, Involved Models, and analysis colors are updated accordingly. This part is explained with more details further in the article. |
| 10 | Involved Models |
Mappings in which the currently selected node is involved. You can double click on a Mapping to open it. |
| 11 | Properties |
Technical information about the selected node, with a clickable link to open the associated Metadata. |
Analysis Editor usage
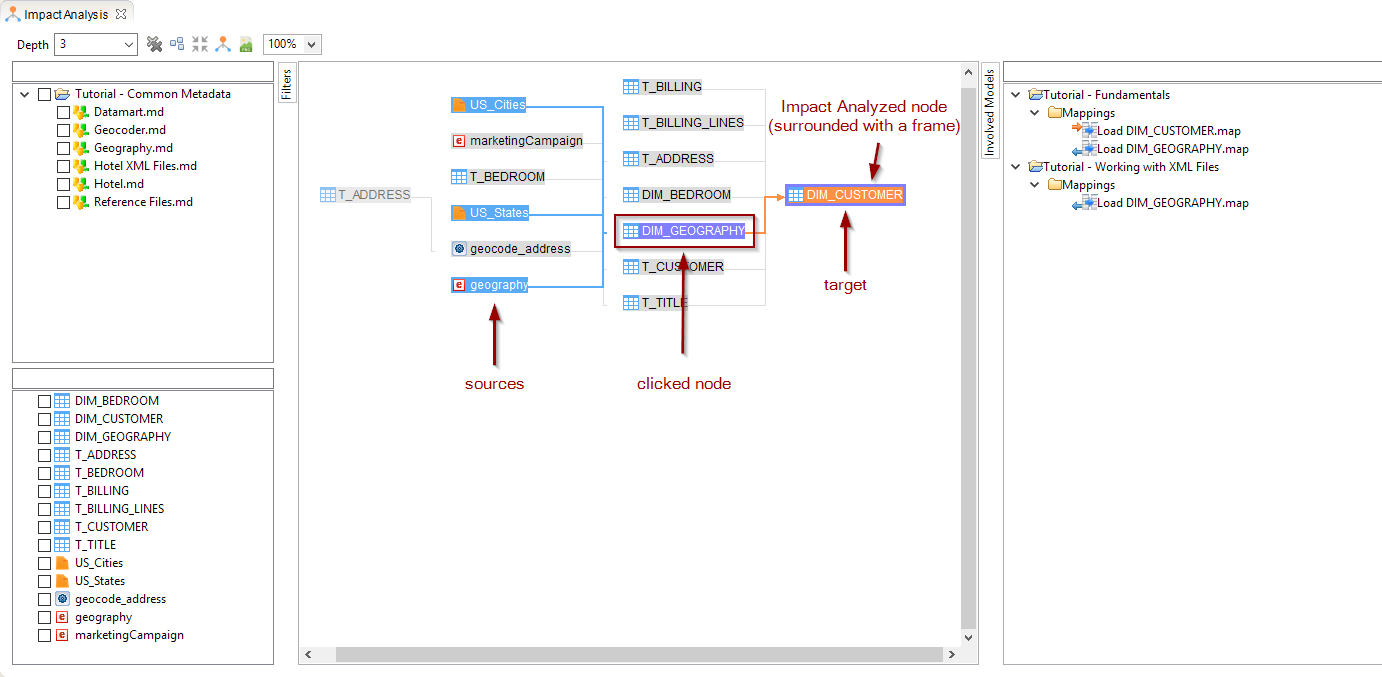
In the analysis, you can click on any node to visualize its flow and impact on the analyzed node.
When a node is clicked, you can see the sources loading it in blue color, and its targets in orange.
The currently selected node appears in purple.
The analyzed node (original node on which we performed the analysis), is surrounded with a purple frame.
For instance, on our previous example: