

Sometimes, the Stambia Support Team may ask a Thread Dump or Heap Dump, for analyzing a particular issue. These elements give precious information to the Support Team, for understanding memory/threads related issues.
This document provides information on how to produce these dumps.
Requirement : Installing a JDK
If the machine where the dumps need to be produced does not have a JDK, then it is necessary to install one.
JDK's can be downloaded from Oracle's website.
Method 1 : using the User Interface VisualVM
Oracle JDK comes with a UI tool "jvisualvm", located into the <jdk>/bin directory.
Once launched, double-click the process which needs to be dumped.
The Heap Dump can be produced from the "Monitor" tab, using the "Heap Dump" button :
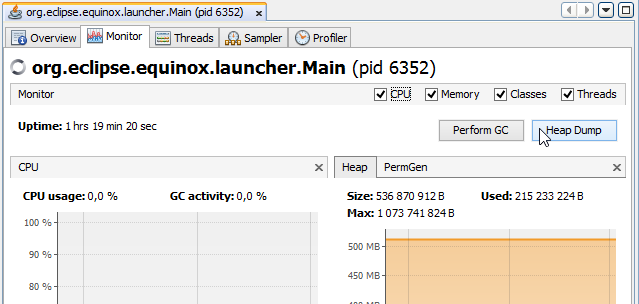
Note : the Heap Dump can only be produced on processes that run on the same JDK instance than VisualVM.
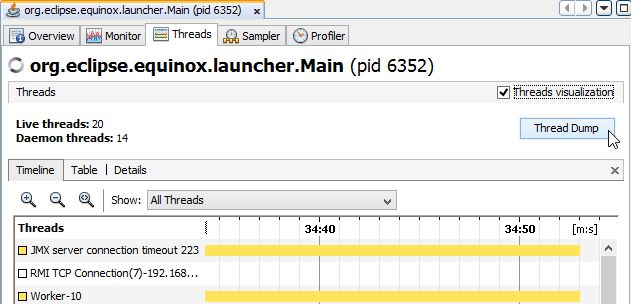
The Thread Dump can be produced from the "Thread" tab, using the "Thread Dump" button :
Method 2 : using Command Line : jps jmap and jstack
Note to Windows users : make sure the command line is started in Admin mode, otherwise you might encounter the message "Access denied" ("Accès refusé" in french).
Use the jps command to list the current processes, and then execute jstack and jmap to produce Thread Dump and Heap Dump :
>jps.exe
7312 Main
6872 org.eclipse.equinox.launcher_1.3.0.v20120522-1813.jar
692 Jps

>jstack.exe 6872 >"d:\temp\jstack.txt"

>jmap.exe -dump:format=b,file=heap.bin 6872
Dumping heap to D:\apps\java\jdk_6_U_23_64\bin\heap.bin ...
Heap dump file created